

ALCUMUS INSIDER | APRIL 2021
Data As An Asset
Join us as we dive deeper into the powerful capabilities of the newly enhanced reporting engine, Safety Intelligence, how customers are using data to create safer workplaces, and much more in this month’s newsletter.

FEATURED THIS MONTH:


FEATURED THIS MONTH:
EcoOnline Insider
Featured Resource
Thought Leadership
Product Updates
Customer Showcase
Tips from Support
EcoOnline Insider
A Sneak Peek at Safety Intelligence
Find out how the Product Team has reimagined the Safety Intelligence solution and experience, with none other than the VP of Product-EHSQ, Harish Pandian.
Featured Resource

Safety Leader Series
Check out our new Safety Leader Series where we’re amplifying the amazing stories and successes from leaders within our community. Get key tips and insight to help you boost safety performance at your organization. Interested in sharing your story?
Please reach out to your Customer Success Coach for more information.
EcoOnline Insider
EcoOnline ContractorCheck – At a Glance
Get a high-level overview of what EcoOnline ContractorCheck is and how it could help your organization, with Accreditation Manager, Robyn Asher.
Featured Resource
Safety Leader Series
Check out our new Safety Leader Series where we’re amplifying the amazing stories and successes from leaders within our community. Get key tips and insight to help you boost safety performance at your organization. Interested in sharing your story? Please reach out to your Customer Success Coach for more information.
Thought Leadership
Safer, Healthier, and Stronger Safety Programs are Anchored on Data
In our newest whitepaper, Data as an Asset: Safer, Healthier, and Stronger Safety Programs are Anchored on Data, we outline the five steps needed to convert data to actionable insights, to elevate your safety program and transform your business. Here’s your sneak peek:
Organizations only use 32% of their data, leaving 68% unused1. This is a fundamental problem resulting in less insight and transparency needed to elevate safety programs to the next level to drive down incident and fatality numbers.
Without the ability to provide the timely collection and access to the right data which aligns with an organization’s safety goals and vision, Environment Health and Safety (EHS) professionals cannot manage, track, or analyze trends that expose gaps in their safety programs. This makes it more difficult to create a proactive strategy and drive safer outcomes to mitigate risks on-site.
There are three common challenges that lessen an organization’s ability to leverage safety data. They are:
- Relying on paper-based systems to collect and manage data
According to market research conducted in 20202, surveying 801 businesses across North America, 25% of safety professionals have said that managing paper-based forms are within their top business challenges. This makes it impossible to gain the real-time insights necessary to mitigate risks on-site and increases the potential for human error.
Even worse, it costs businesses thousands of dollars every year. A Constructor Magazine article, Dealing With Data in the Construction Industry3 published in February of 2020 details that it is the lack of centralized storage and structured management of the data that leads to unused data. Workers that have ready access to real-time data gain 4.5 hours back in their work week, that’s over 230 hours a year per person, which equates to over $4,500 per employee. Examples of how this can add up for any business:
- 100 employees = $450,000/year
- 500 employees = $2,500,000/year
By relying on paper to collect and manage information, finding the right data becomes arduous and time consuming, making leveraging the information EHS professionals need when they need it, extremely difficult, if not impossible at times.
- Reporting siloes make data inaccessible to all key stakeholders
Many organizations face reporting or data siloes, where the information is trapped and not clearly visible or readily accessible to the required team members. Outlined in our whitepaper, A Market Guide to Global EHS Software 2021, “accessing data is crucial…to truly transform your organization a wider view of incorporating [data from] other critical areas of your business will help to make informed decisions and take positive action.”
To make the shift from a reactive to a proactive safety program, all team members from boardroom executives to front-line workers must have easy access to the data that impacts their role. By closing the feedback loop and ensuring communication is streamlined, safety professionals can make quicker, data-driven decisions reflecting their overall safety goals and vision.
- The inability to track trends and patterns
Without access to the right data in full, safety professionals are unable to effectively track trends and patterns that would result in a more efficient and proactive safety approach. A lack of 360-degree insight into the required data points, such as leading and lagging indicators, compliance and training efficacy, etc., makes it more difficult to take value from the data being collecting.
Without the ability for EHS professionals to analyze their safety program to expose gaps and weaknesses and explore correlations between different data sets, the ability to drive safer outcomes becomes greatly diminished. As a result, the desired outcome of reducing incidents and injuries that protect people and businesses becomes more challenging and less likely.
Resolving These Core Challenges
Check out our full whitepaper Data as an Asset: Safer, Healthier, and Stronger Safety Programs are Anchored on Data to learn more.
Product Updates
EcoOnline North America Foundations | Safety Intelligence
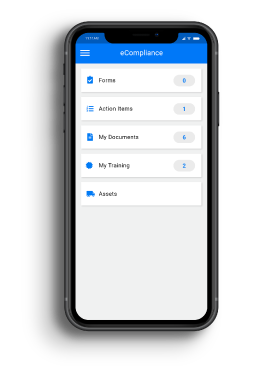
Forms and training are being completed, action items assigned and documents acknowledged – but you want to know what, when, where, and how can we be safer? As part three of our EcoOnline eCompliance Foundations series, Strategic Customer Success Manager, Emma Beaumont, shows you how start visualizing and analyzing the data that is in your eCompliance account. Discover how to navigate our new reporting tool and the different filter options that can be applied to our out of the box dashboards, as well as how to start setting up your own.
If you missed our webinar on April 21st, check it out here.

How to Best Leverage FiD Data
It is important to be able to access your data within Field iD and extract it when it’s needed. See below for some tips and suggestions to help you do so:
1. Know where and how
- Assets details
You can export all of your asset data and information by navigating to the ‘Search’ tab. From here, you can use the filters to refine the list of assets or view them all. You will then be able to select all of the assets and use the ‘Mass Actions’ button to export the data to excel.
- Event details
You can do the same as you can with the assets but with your main event details from the ‘Reporting’ tab. Follow the same steps as you would when exporting the assets. There is also a ‘Summary Report’ option where you can see a clear breakdown of your events by asset type, event type, and a daily breakdown.
- Event answers
This export is hosted in a different location which can be accessed by clicking on your name in the top right hand corner of the screen and then clicking on the tab ‘Export Events’. From here, you can export the event details and answers for your different event types. This will help you be able to identify trends across questions and answers within the different event types.
2. Define your content
- Filters
When exporting your asset and event details you can determine what group of information you want to see and export by adding filters from the pane on the left-hand side.
- Columns
Next to the filter icon is a table icon where you can change the columns of information you’re seeing in the results to ensure you’re seeing and exporting all of the information you need to. You are also able to change the default column layout from the ‘Setup’ tab so that you don’t have to change the columns every time you run a report.
3. Automate it – let the data come to you!
- Save your reports
Once you have added your filters and changed your columns you can then save those settings so you can easily access the report from the ‘Saved Items’ section in the top right hand corner of the screen.
- Schedule your reports
Rather than going into Field iD to find the data, let it come to you by setting up automated schedules for the report to come right to your inbox when you need it. This can be set up and managed from the ‘Saved Items’ section also.

Reporting and Dashboards
The dashboard interface creates a simplified and powerful view of the current status of your contractor list. View real-time compliance information at-a-glance and set internal benchmarks for your organization. You can also access preferred vendor lists, share notes, and rank vendors internally.
The reporting functionality is an important feature of the portal, allowing you to pull health, safety, and compliance reports whenever you need them. Gain insight into compliance through analytics, fueled by real-time contractor health, safety, and insurance data.
With customizable safety dashboards, offering real-time insights, you’ll gain a comprehensive view of your contractor compliance program to remain proactive and mitigate risks before they occur. You can standardize your compliance reporting to fully understand your supply chain, enabling you to effectively monitor, manage, and make informed decisions about who you work with.
Customer Showcase
Leveraging EHS Data to Drive Safety Performance
Missed our webinar with Roseburg Forest Products? We’ve got you covered!
We sat down with Environmental Health and Safety coordinator, Cassandra Crosier, to learn more about the power of EHS data and how it can revolutionize your safety program. Find out how to utilize EHS data and drive safety performance as we focus on:
- What type of EHS data safety leaders should focus on
- How leading organizations are using EHS data to accelerate safety performance and business results
- Why EHS data is your key to safety success
Support Tip
Subscribe to Reports in Safety Intelligence
Subscribe to Reports in Safety Intelligence
Thought Leadership
Safer, Healthier, and Stronger Safety Programs are Anchored on Data
In our newest whitepaper, Data as an Asset: Safer, Healthier, and Stronger Safety Programs are Anchored on Data, we outline the five steps needed to convert data to actionable insights, to elevate your safety program and transform your business. Here’s your sneak peek:
Organizations only use 32% of their data, leaving 68% unused1. This is a fundamental problem resulting in less insight and transparency needed to elevate safety programs to the next level to drive down incident and fatality numbers.
Without the ability to provide the timely collection and access to the right data which aligns with an organization’s safety goals and vision, Environment Health and Safety (EHS) professionals cannot manage, track, or analyze trends that expose gaps in their safety programs. This makes it more difficult to create a proactive strategy and drive safer outcomes to mitigate risks on-site.
There are three common challenges that lessen an organization’s ability to leverage safety data. They are:
- Relying on paper-based systems to collect and manage data
According to market research conducted in 20202, surveying 801 businesses across North America, 25% of safety professionals have said that managing paper-based forms are within their top business challenges. This makes it impossible to gain the real-time insights necessary to mitigate risks on-site and increases the potential for human error.
Even worse, it costs businesses thousands of dollars every year. A Constructor Magazine article, Dealing With Data in the Construction Industry3 published in February of 2020 details that it is the lack of centralized storage and structured management of the data that leads to unused data. Workers that have ready access to real-time data gain 4.5 hours back in their work week, that’s over 230 hours a year per person, which equates to over $4,500 per employee. Examples of how this can add up for any business:
- 100 employees = $450,000/year
- 500 employees = $2,500,000/year
By relying on paper to collect and manage information, finding the right data becomes arduous and time consuming, making leveraging the information EHS professionals need when they need it, extremely difficult, if not impossible at times.
- Reporting silos make data inaccessible to all key stakeholders
Many organizations face reporting or data siloes, where the information is trapped and not clearly visible or readily accessible to the required team members. Outlined in our whitepaper, A Market Guide to Global EHS Software 2021, “accessing data is crucial…to truly transform your organization a wider view of incorporating [data from] other critical areas of your business will help to make informed decisions and take positive action.”
To make the shift from a reactive to a proactive safety program, all team members from boardroom executives to front-line workers must have easy access to the data that impacts their role. By closing the feedback loop and ensuring communication is streamlined, safety professionals can make quicker, data-driven decisions reflecting their overall safety goals and vision.
- The inability to track trends and patterns
Without access to the right data in full, safety professionals are unable to effectively track trends and patterns that would result in a more efficient and proactive safety approach. A lack of 360-degree insight into the required data points, such as leading and lagging indicators, compliance and training efficacy, etc., makes it more difficult to take value from the data being collecting.
Without the ability for EHS professionals to analyze their safety program to expose gaps and weaknesses and explore correlations between different data sets, the ability to drive safer outcomes becomes greatly diminished. As a result, the desired outcome of reducing incidents and injuries that protect people and businesses becomes more challenging and less likely.
Resolving These Core Challenges
Check out our full whitepaper Data as an Asset: Safer, Healthier, and Stronger Safety Programs are Anchored on Data to learn more.
Product Updates
EcoOnline North America Foundations Webinar | Safety Intelligence – Save Your Seat!
Forms and training are being completed, action items assigned and documents acknowledged – but you want to know what, when, where, and how can we be safer? As part three of our EcoOnline North America Foundations series, Strategic Customer Success Manager, Emma Beaumont, will show you how to start visualizing and analyzing the data that is in your eCompliance account. Discover how to navigate our new reporting tool and the different filter options that can be applied to our out of the box dashboards, as well as how to start setting up your own.
Don’t miss this webinar on April 27, at 1pm ET. Register now.
How to Best Leverage Field iD Data
It is important to be able to access your data within Field iD and extract it when it’s needed. See below for some tips and suggestions to help you do so:
1. Know where and how
- Assets details: You can export all of your asset data and information by navigating to the ‘Search’ tab. From here, you can use the filters to refine the list of assets or view them all. You will then be able to select all of the assets and use the ‘Mass Actions’ button to export the data to excel.
- Event details: You can do the same as you can with the assets but with your main event details from the ‘Reporting’ tab. Follow the same steps as you would when exporting the assets. There is also a ‘Summary Report’ option where you can see a clear breakdown of your events by asset type, event type, and a daily breakdown.
- Event answers: This export is hosted in a different location which can be accessed by clicking on your name in the top right hand corner of the screen and then clicking on the tab ‘Export Events’. From here, you can export the event details and answers for your different event types. This will help you be able to identify trends across questions and answers within the different event types.
2. Define your content
- Filters: When exporting your asset and event details you can determine what group of information you want to see and export by adding filters from the pane on the left-hand side.
- Columns: Next to the filter icon is a table icon where you can change the columns of information you’re seeing in the results to ensure you’re seeing and exporting all of the information you need to. You are also able to change the default column layout from the ‘Setup’ tab so that you don’t have to change the columns every time you run a report.
3. Automate it – let the data come to you!
- Save your reports: Once you have added your filters and changed your columns you can then save those settings so you can easily access the report from the ‘Saved Items’ section in the top right hand corner of the screen.
- Schedule your reports: Rather than going into Field iD to find the data, let it come to you by setting up automated schedules for the report to come right to your inbox when you need it. This can be set up and managed from the ‘Saved Items’ section also.
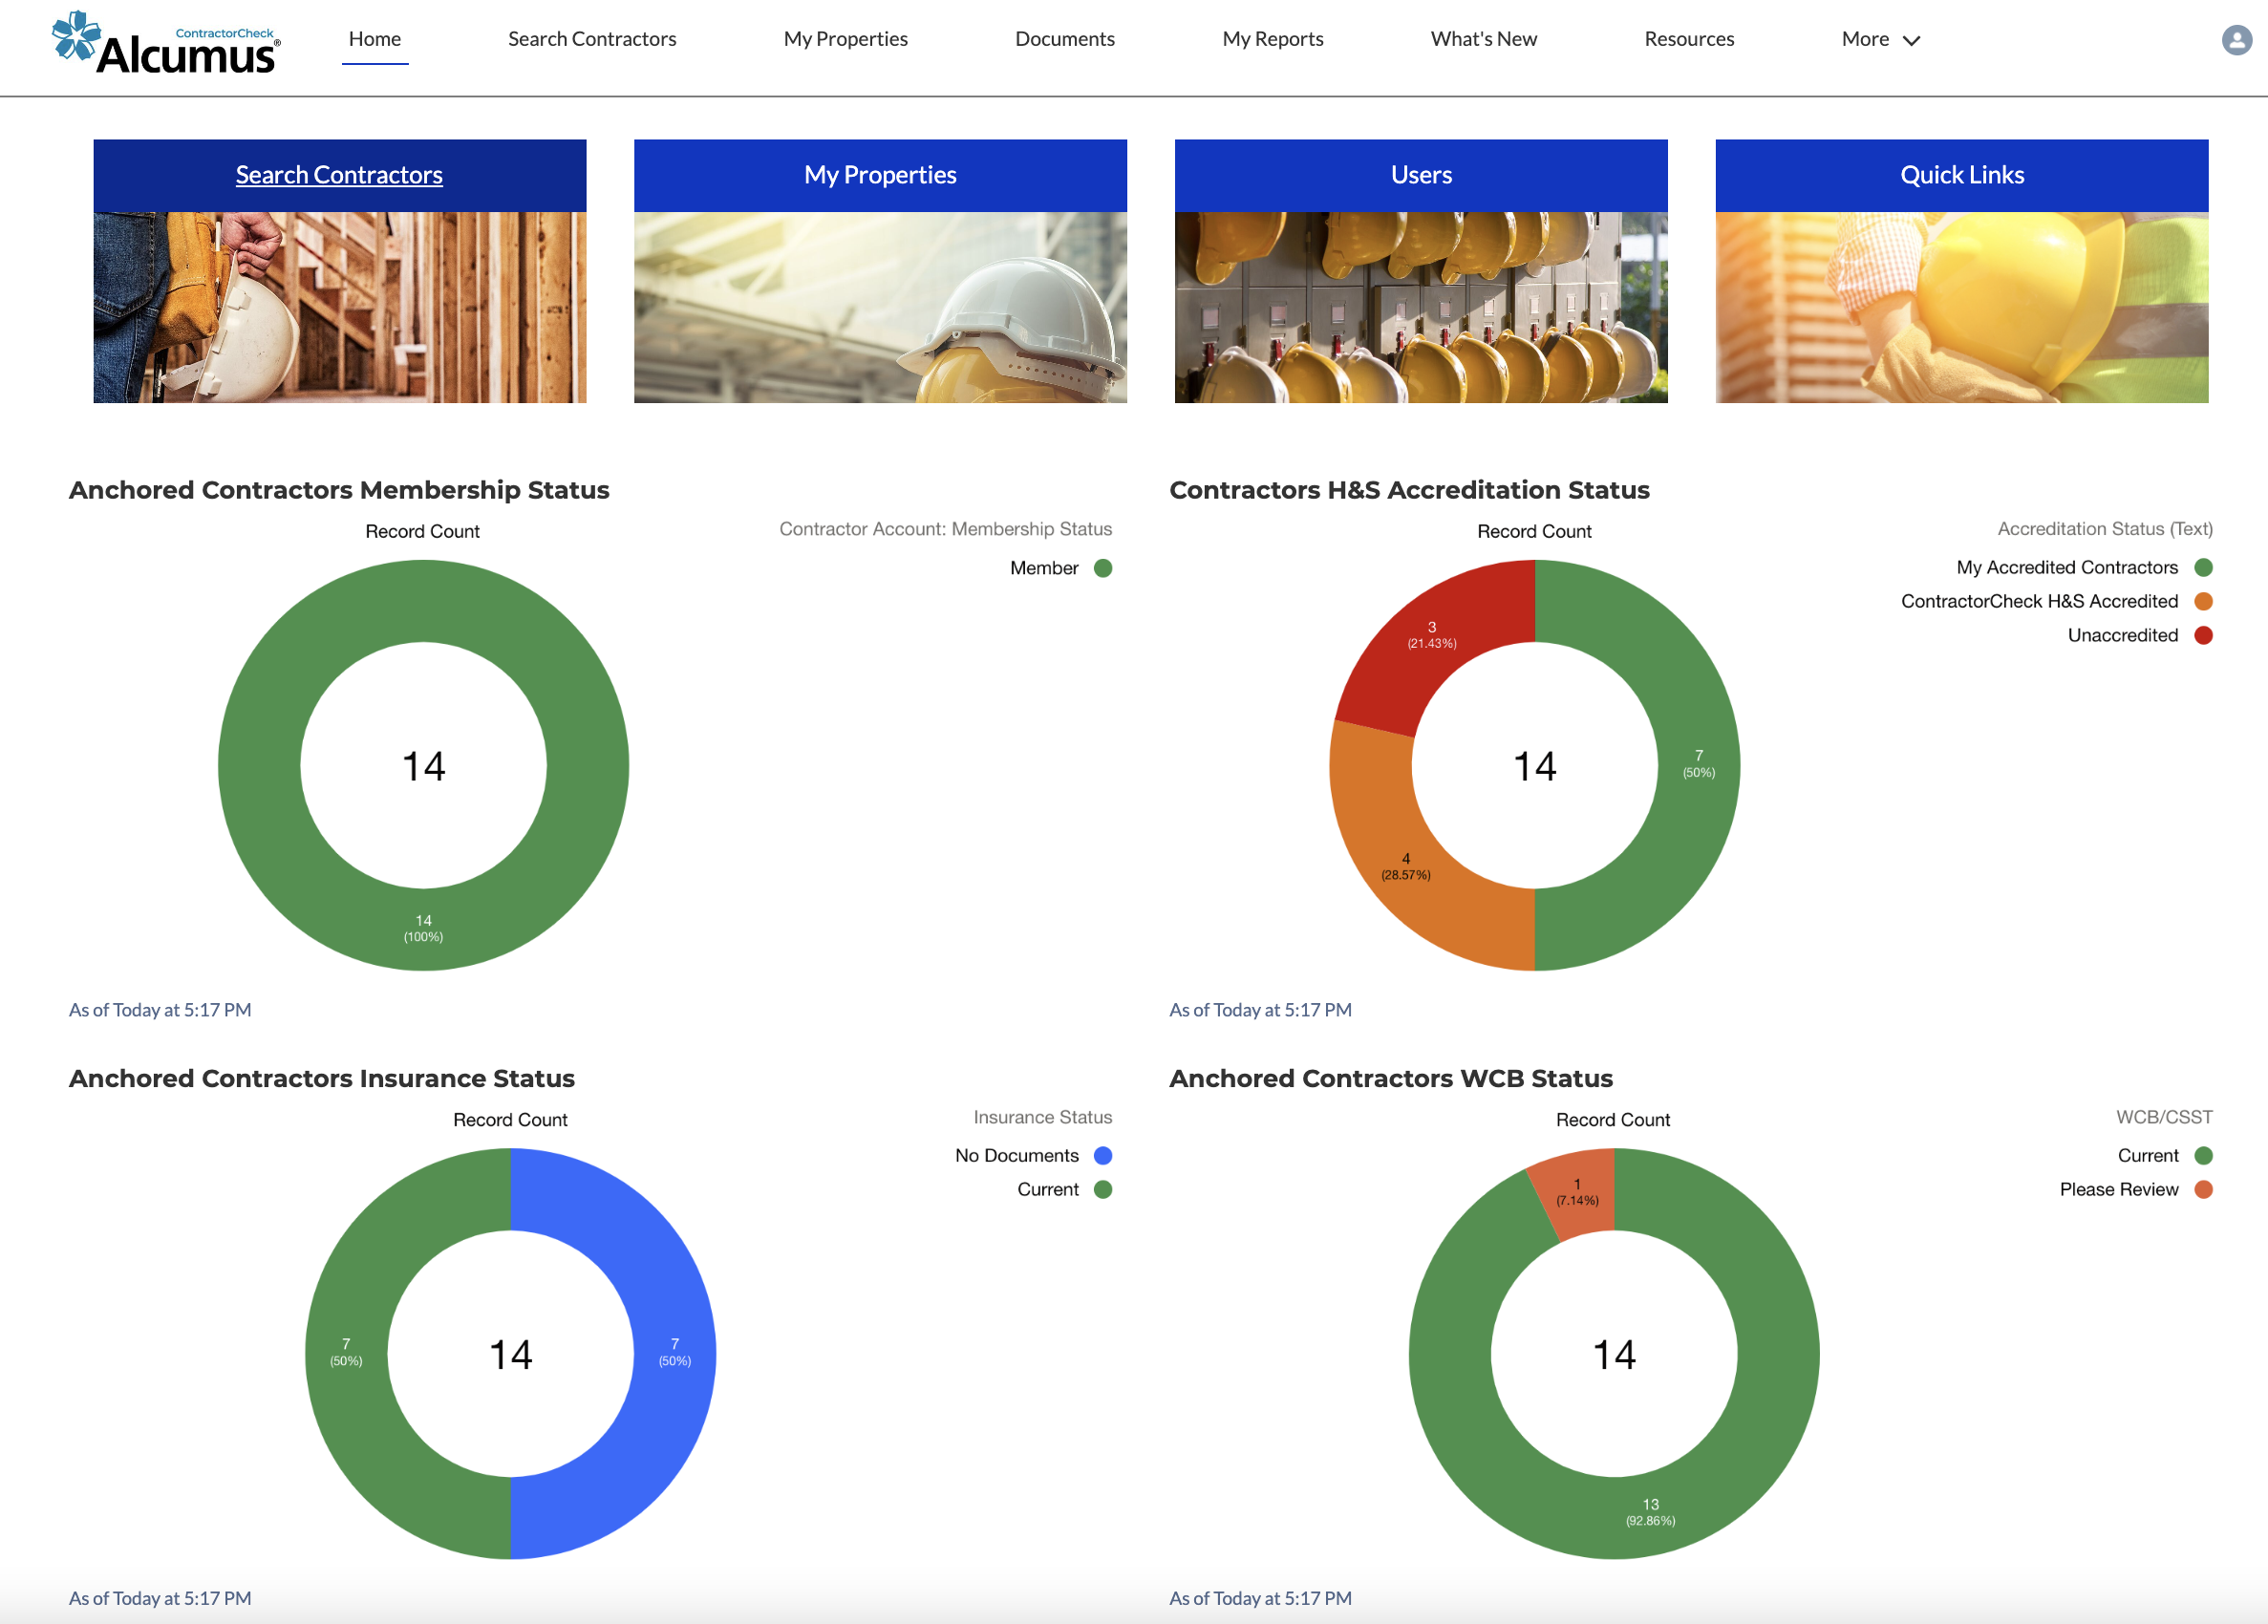
Reporting and Dashboards
The EcoOnline ContractorCheck Client portal provides you with the tools you need to gain visibility across your contractors. Get real-time access to information including Health and Safety documents, policies, training, insurance and workers’ compensation certificates, specific corporate requirements, and compliance history.
The dashboard interface creates a simplified and powerful view of the current status of your contractor list. View real-time compliance information at-a-glance and set internal benchmarks for your organization. You can also access preferred vendor lists, share notes, and rank vendors internally.
The reporting functionality is an important feature of the portal, allowing you to pull health, safety, and compliance reports whenever you need them. Gain insight into compliance through analytics, fueled by real-time contractor health, safety, and insurance data.
With customizable safety dashboards, offering real-time insights, you’ll gain a comprehensive view of your contractor compliance program to remain proactive and mitigate risks before they occur. You can standardize your compliance reporting to fully understand your supply chain, enabling you to effectively monitor, manage, and make informed decisions about who you work with.
Customer Showcase
Webinar | Leveraging EHS Data to Drive Safety Performance
Missed our webinar with Roseburg Forest Products? We’ve got you covered!
We sat down with Roseburg’s Environmental Health and Safety coordinator, Cassandra Crosier, and EcoOnline Vice President of Corporate Strategy and Development Mark Kingston, to learn more about the power of EHS data and how it can revolutionize your safety program. Find out how to utilize EHS data and drive safety performance as we focus on:
- What type of EHS data safety leaders should focus on
- How leading organizations are using EHS data to accelerate safety performance and business results
- Why EHS data is your key to safety success
Check it out now.
Support Tips
Subscribe to Reports in Safety Intelligence