

Share this Post

PUBLISHED
April 22, 2021
READ TIME
5 Minutes
WRITTEN BY
![]()
![]() Dina Adlouni
Dina Adlouni
Dina is the resident Content Writer at EcoOnline North America . When she’s not writing about health and safety, you’ll find her enjoying a cup of tea while watching her favorite sitcom.
Only 32% of data is used by organizations1! This means 68% of it is unusable due to poor management and storage, data siloes, and more.
A mid-sized firm of 150 employees is losing over 34,000 people hours a year, equating to $690,000 in lost time. However, organizations that do use their data perform 65% better than their peers2. With ready access to real-time data, workers also gain 4.5 hours back in their week.
With all of this in mind, have you been struggling to capture the right data to mitigate risks at your organization? Are you finding it difficult to proactively manage your safety program?
We want to change this! Our team of data technologists have evolved our suite of products to include EcoOnline Safety Intelligence. EcoOnline Safety Intelligence is a robust reporting engine helping organizations leverage safety data and deliver data insights.
“The development of EcoOnline Safety Intelligence has been highly anticipated by not only those on our internal EcoOnline team, but the businesses we have worked with as beta users and prospects alike,” says Harish Pandian, VP of Product -EHSQ, EcoOnline. “The depth of this newly upgraded business intelligence tool is focused on revamping how safety leaders view data and the true power it holds to keep their workforce safe. This is only the beginning of what we are bringing to market in 2021 and moving forward. We are aiming to revolutionize the way safety leaders understand and intake data to strengthen their workforce for generations to come.”
Let’s take a look at exactly how EcoOnline Safety Intelligence can help you:
1. Simplify Reporting and Dashboards
EcoOnline Safety Intelligence solves your safety challenges by simplifying reporting and dashboards. With the ability to easily configure, generate, and view the information you need in the format you want, you can now leverage your data to the fullest.
One of the first ways this business intelligence tool helps you simplify reporting is by helping you gain complete visibility into your safety program adoption and performance in real time. With quick and easy access to your safety KPIs and dashboards, you can get a 360–view of all essential elements helping you drive accountability and increase participation and engagement rates across your team.
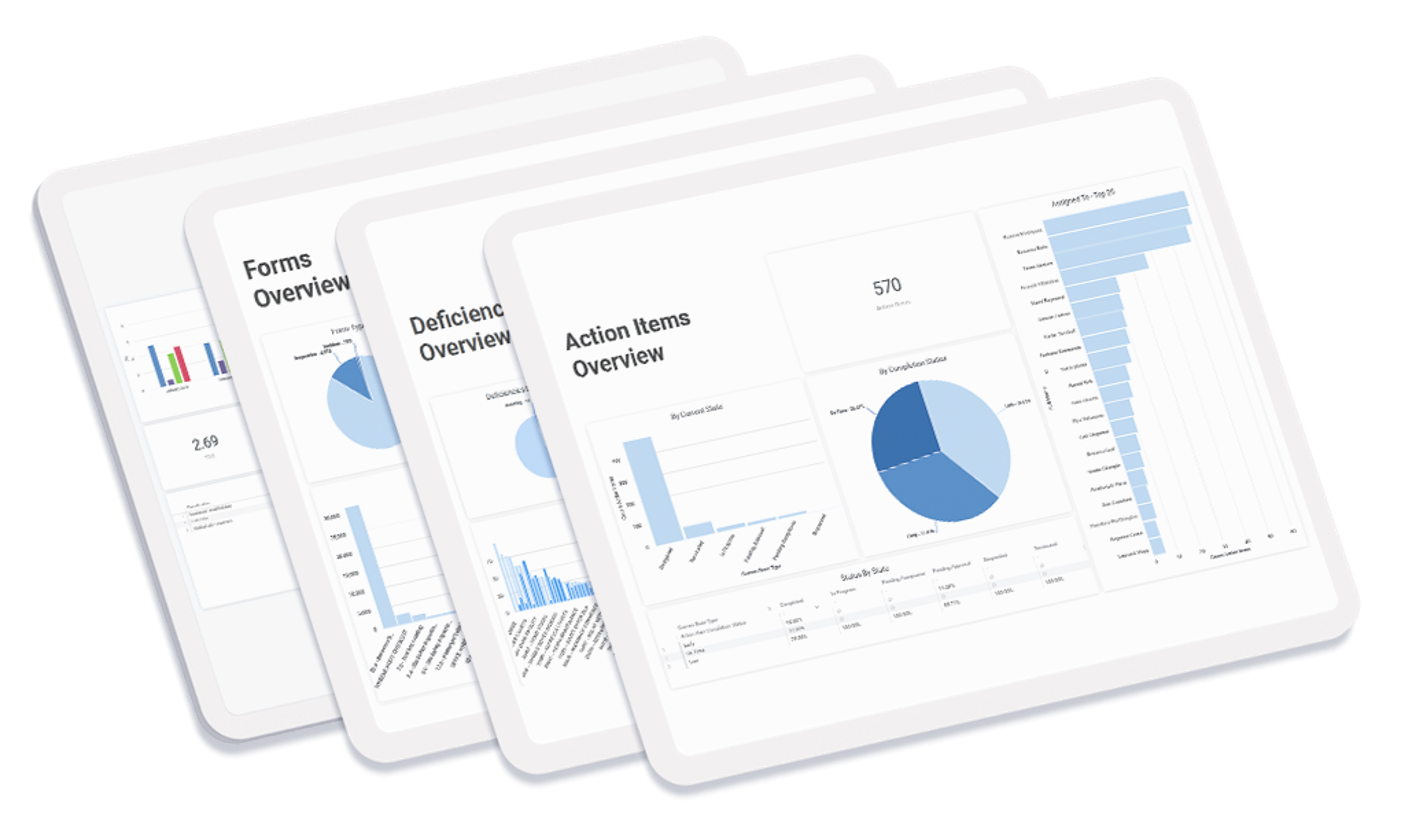
Giving you the ability to personalize your experience is another way Safety Intelligence simplifies reporting, as you can quickly locate the data you need through your dashboards. Safety Intelligence contains 20+ out of the box dashboards based on most common use scenarios. Our easily configurable dashboards make all data accessible and visible to all key stakeholders.
The ability to filter and save dashboards, for example, allows you to slice and dice the data to provide an overview of the information you want to see. You can even embed dashboards to the homepage to close the feedback loop and give users the ability to see the data as soon as they log in.
“EcoOnline Safety Intelligence has helped us save the time of running reports making our processes more efficient, with its simple and user-friendly functionality. Managers can easily set up their own dashboards allowing them to drill into specifics for each site, providing access to real-time data available as soon as you log in. A visually attractive and well-organized user experience.” – Darla Beck, Senior EH&S Technician, BraunAbility
2. Reduce Incidents and Ensure Compliance
Now that you can collect and see the data you need when you need it, you can start to make data-driven decisions to effectively reduce incidents and ensure compliance.
The ability to schedule dashboards helps make management reporting simple with executive-ready dashboards. With EcoOnline Safety Intelligence, you can schedule management KPIs and automate your dashboards to be sent to key players with actionable insights from your safety data, at a cadence that suits your reporting schedule best.
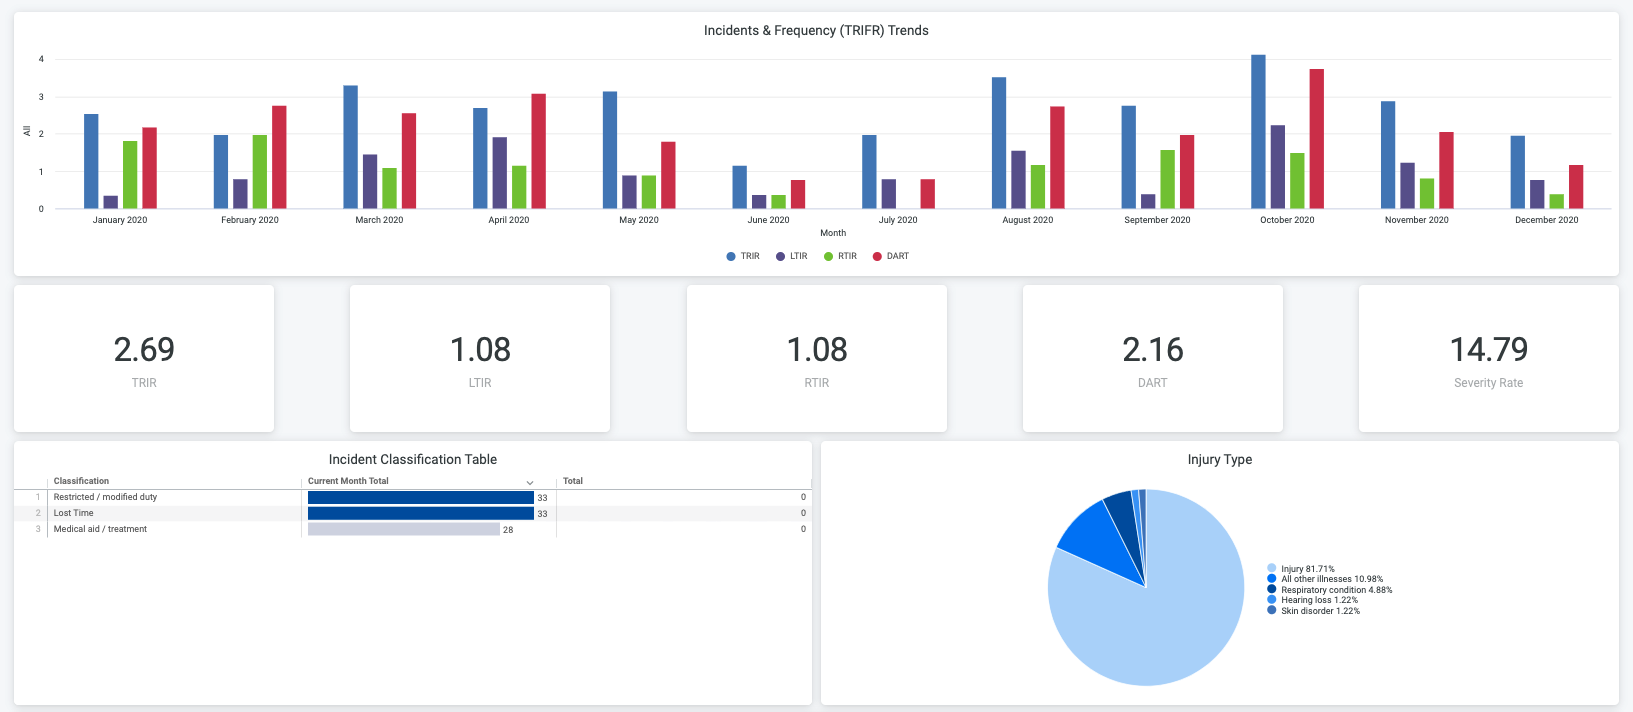
The Standard Incident Classification dashboard provides a view of the incidents and injuries reported at your organization, as well as dates, classification, and more, with metrics that communicate the maturity of your safety program.
With a library of 20+ dashboards, tracking KPIs, trends, and leading and lagging indicators helps you assess where the gaps in your safety program lie. Here are some of the most commonly used reports within Safety Intelligence:
“We wanted to create a way to effectively communicate a high level of HSE compliance for different levels of management in our organization. Using EcoOnline Safety Intelligence, we created dashboards from the top level of our organization that can be filtered down to each shop level so that respective levels of management can easily observe the compliance rates to some of our key HSE management system requirements.” – Cheryl Feddema, Health, Safety & Environment Management, Craftsman Collision
3. Explore Predictive Analytics
With the ability to now make data-driven decisions, we’ve taken it one step further by giving you the ability to explore predictive analytics. This will help differentiate your organization from competitors, as you can elevate your safety program to pivot from reactive to proactive.
EcoOnline Safety Intelligence helps you analyze safety information, presented in your chosen format previously configured, to make quick fact-based decisions. Having the ability to drill down and filter the information, allows you to dive even deeper to discover if there are correlations between various data sets. This will help you create an even safer working environment as you can now make data-driven correlations to proactively manage safety. And of course, ensure your team gets home safely to their loved ones.
The right data can truly help you revolutionize your safety program. From allowing you complete transparency into your safety program, to the ability to make and action data-driven decisions, the time is now: the future of reporting is finally here.
Discover how our robust reporting engine, EcoOnline Safety Intelligence, can help you discover trends, reduce risks, and prevent incidents to help you drive safer outcomes. See it in action at our most anticipated virtual event on May 12th at 2pm EST.
Resources:
1 Seagate Technology plc, ‘Rethink Data’ Report Reveals That 68% of Data Available to Businesses Goes Unleveraged, July 2020
2 McKinsey & Co., Catch them if you can: How leaders in data and analytics have pulled ahead, Sept. 2019
Speak to an EcoOnline Safety Expert Today
Unleash the Potential Within Your Safety Data Now
You've been added to our distribution list.